SimPEG Meshes
The Mesh objects in SimPEG provide a numerical grid on which to solve differential equations. Each mesh type has a similar API to make switching between different meshes relatively simple.
Overview of Meshes Available
Please see the discretize docs
Each mesh code follows the guiding principles that are present in this tutorial, but the details, advantages and disadvantages differ between the implementations.

Variable Locations and Terminology
We will go over the basics of using a TensorMesh, but these skills are transferable to the other meshes available in SimPEG. All of the mesh generation code is located in the Mesh package in SimPEG (i.e. discretize).
To create a TensorMesh we need to create mesh tensors, the widths of each cell of the mesh in each dimension. We will call these tensors h, and these will be define the constant widths of cells in each dimension of the TensorMesh.
import discretize
import numpy as np
import matplotlib.pyplot as plt
hx = np.r_[3,2,1,1,1,1,2,3]
hy = np.r_[3,1,1,3]
M = discretize.TensorMesh([hx, hy])
M.plotGrid(centers=True)
plt.show()
(Source code, png, hires.png, pdf)
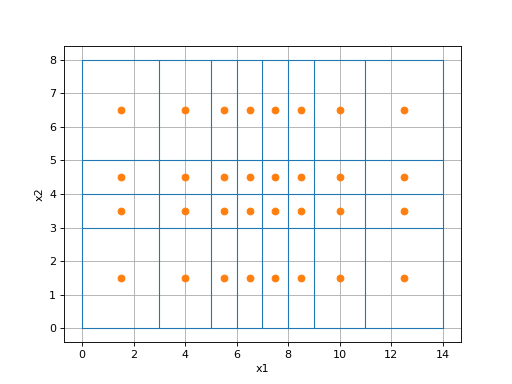
In this simple mesh, the hx vector defines the widths of the cell in the x dimension, and starts counting from the origin (0,0). The resulting mesh is divided into cells, and the cell-centers are plotted above as red circles. Other terminology for this mesh are:
cell-centers
nodes
faces
edges
import discretize
import numpy as np
import matplotlib.pyplot as plt
hx = np.r_[3,2,1,1,1,1,2,3]
hy = np.r_[3,1,1,3]
M = discretize.TensorMesh([hx, hy])
M.plotGrid(faces=True, nodes=True)
plt.title('Cell faces in the x- and y-directions.')
plt.legend(('Nodes', 'X-Faces', 'Y-Faces'))
plt.show()
(Source code, png, hires.png, pdf)
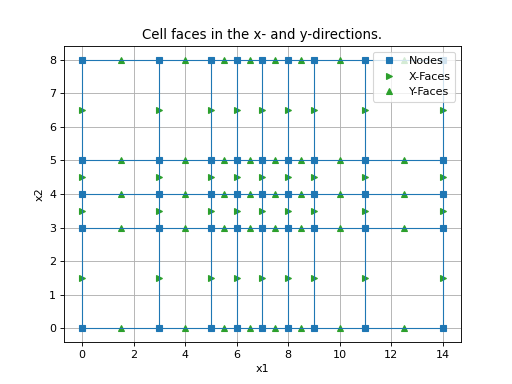
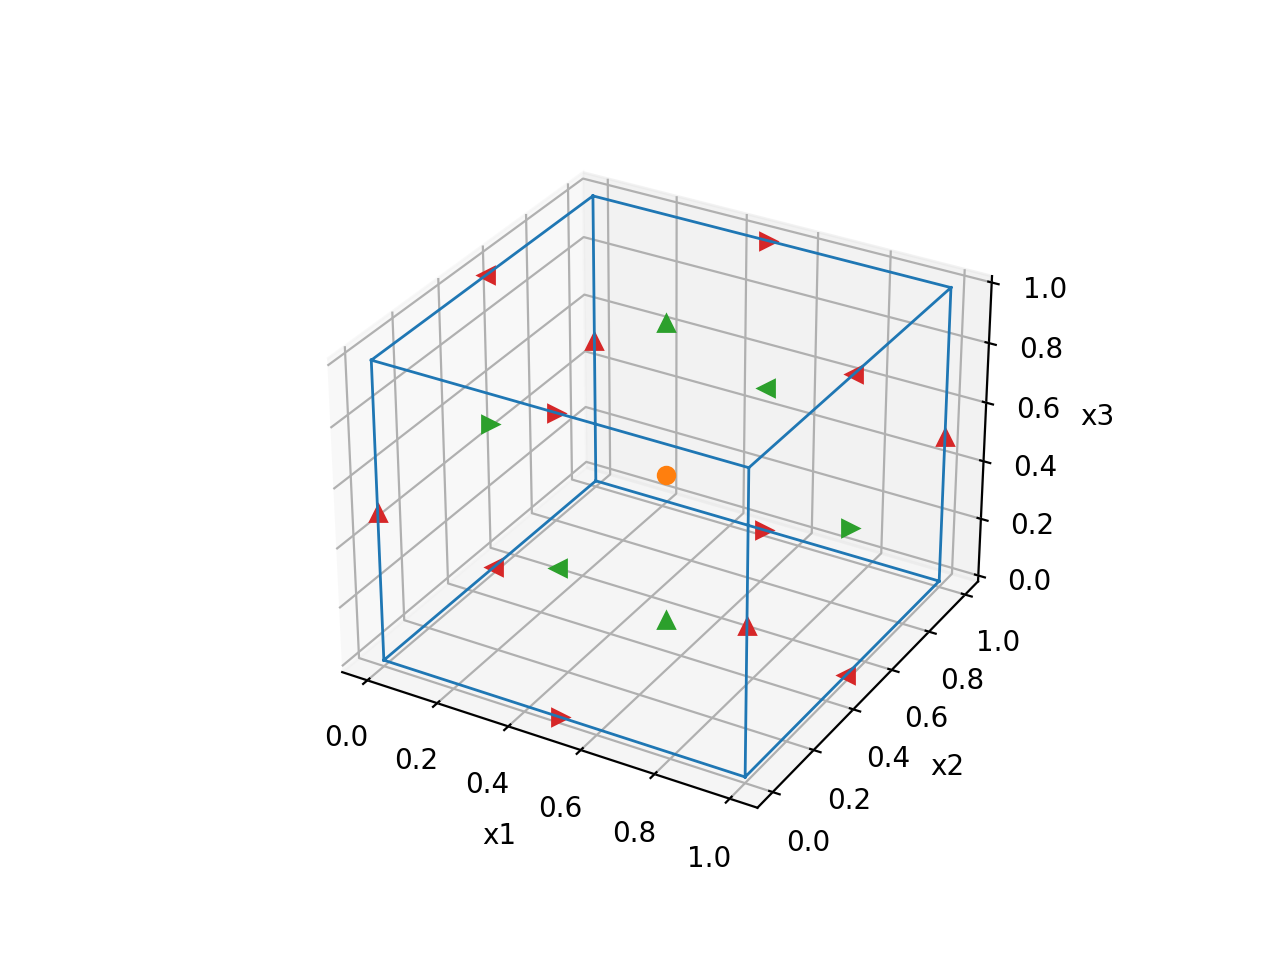
Generally, the faces are used to discretize fluxes, quantities that leave or enter the cells. As such, these fluxes have a direction to them, which is normal to the cell (i.e. directly out of the cell face). The plot above shows that x-faces point in the x-direction, and y-faces point in the y-direction. The nodes are shown in blue, and lie at the intersection of the grid lines. In a two-dimensional mesh, the edges actually live in the same location as the faces, however, they align (or are tangent to) the face. This is easier to see in 3D, when the edges do not live in the same location as the faces. In the 3D plot below, the edge variables are seen as black triangles, and live on the edges(!) of the cell.
from __future__ import print_function
import discretize
discretize.TensorMesh([1,1,1]).plotGrid(faces=True, edges=True, centers=True, showIt=True)
(Source code, png, hires.png, pdf)
How many of each?
When making variables that live in each of these locations, it is important to know how many of each variable type you are dealing with. SimPEG makes this pretty easy:
In [1]: print(M)
        ---- 2-D TensorMesh ----
         x0: 0.00
         y0: 0.00
        nCx: 8
        nCy: 4
         hx: 3.00, 2.00, 4*1.00, 2.00, 3.00
         hy: 3.00, 2*1.00, 3.00

In [2]: count = {'numCells': M.nC,
  ....:          'numCells_xDir': M.nCx,
  ....:          'numCells_yDir': M.nCy,
  ....:          'numCells_vector': M.vnC}

In [3]: print('This mesh has %(numCells)d cells, which is %(numCells_xDir)d*%(numCells_yDir)d!!' % count)

        This mesh has 32 cells, which is 8*4!!

In [4]: print(count)

        {
         'numCells_vector': array([8, 4]),
         'numCells_yDir': 4,
         'numCells_xDir': 8,
         'numCells': 32
        }
SimPEG also counts the nodes, faces, and edges.
Nodes: M.nN, M.nNx, M.nNy, M.nNz, M.vnN
Faces: M.nF, M.nFx, M.nFy, M.nFz, M.vnF, M.vnFx, M.vnFy, M.vnFz
Edges: M.nE, M.nEx, M.nEy, M.nEz, M.vnE, M.vnEx, M.vnEy, M.vnEz
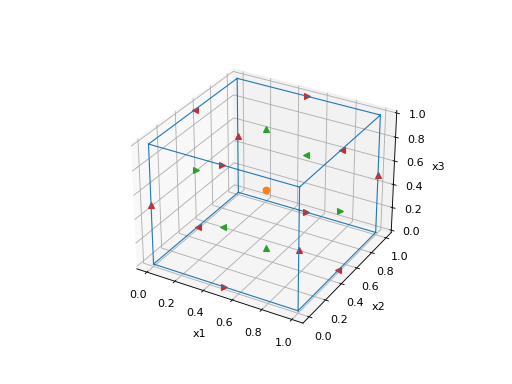
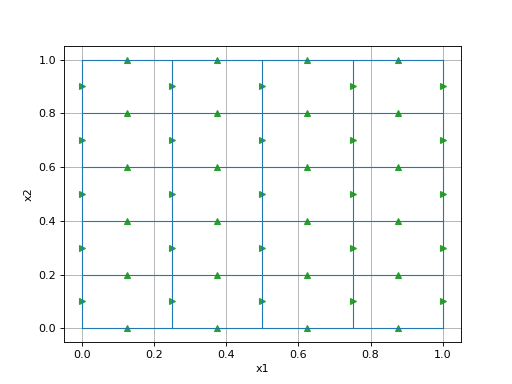
Face and edge variables have different counts depending on the dimension of the direction that you are interested in. In a 4x5 mesh, for example, there is a 5x5 grid of x-faces, and a 4x6 grid of y-faces. You can count them below! As such, the vnF(x,y,z) and vnE(x,y,z) properties give the vector grid size.
import discretize
discretize.TensorMesh([4,5]).plotGrid(faces=True, showIt=True)
(Source code, png, hires.png, pdf)
Making Tensors
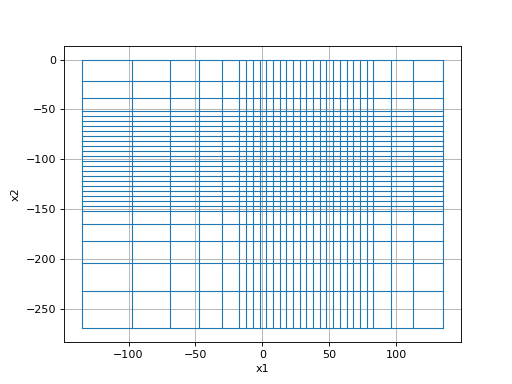
For tensor meshes, there are some additional functions that can come in handy. For example, creating mesh tensors can be a bit time consuming, these can be created speedily by just giving numbers and sizes of padding. See the example below, that follows this notation:
h1 = (
       (cellSize, numPad, [, increaseFactor]),
       (cellSize, numCore),
       (cellSize, numPad, [, increaseFactor])
     )
import discretize
from SimPEG import utils
h1 = [(10, 5, -1.3), (5, 20), (10, 3, 1.3)]
M = discretize.TensorMesh([h1, h1], x0='CN')
M.plotGrid(showIt=True)
(Source code, png, hires.png, pdf)

Note
You can center your mesh by passing a ‘C’ for the x0[i] position. A ‘N’ will make the entire mesh negative, and a ‘0’ (or a 0) will make the mesh start at zero.
Hopefully, you now know how to create TensorMesh objects in SimPEG, and by extension you are also familiar with how to create and use other types of meshes in this SimPEG framework.
The API
See the discretize docs